
Tennis odds and implied probability: what they really say
· Pronocast
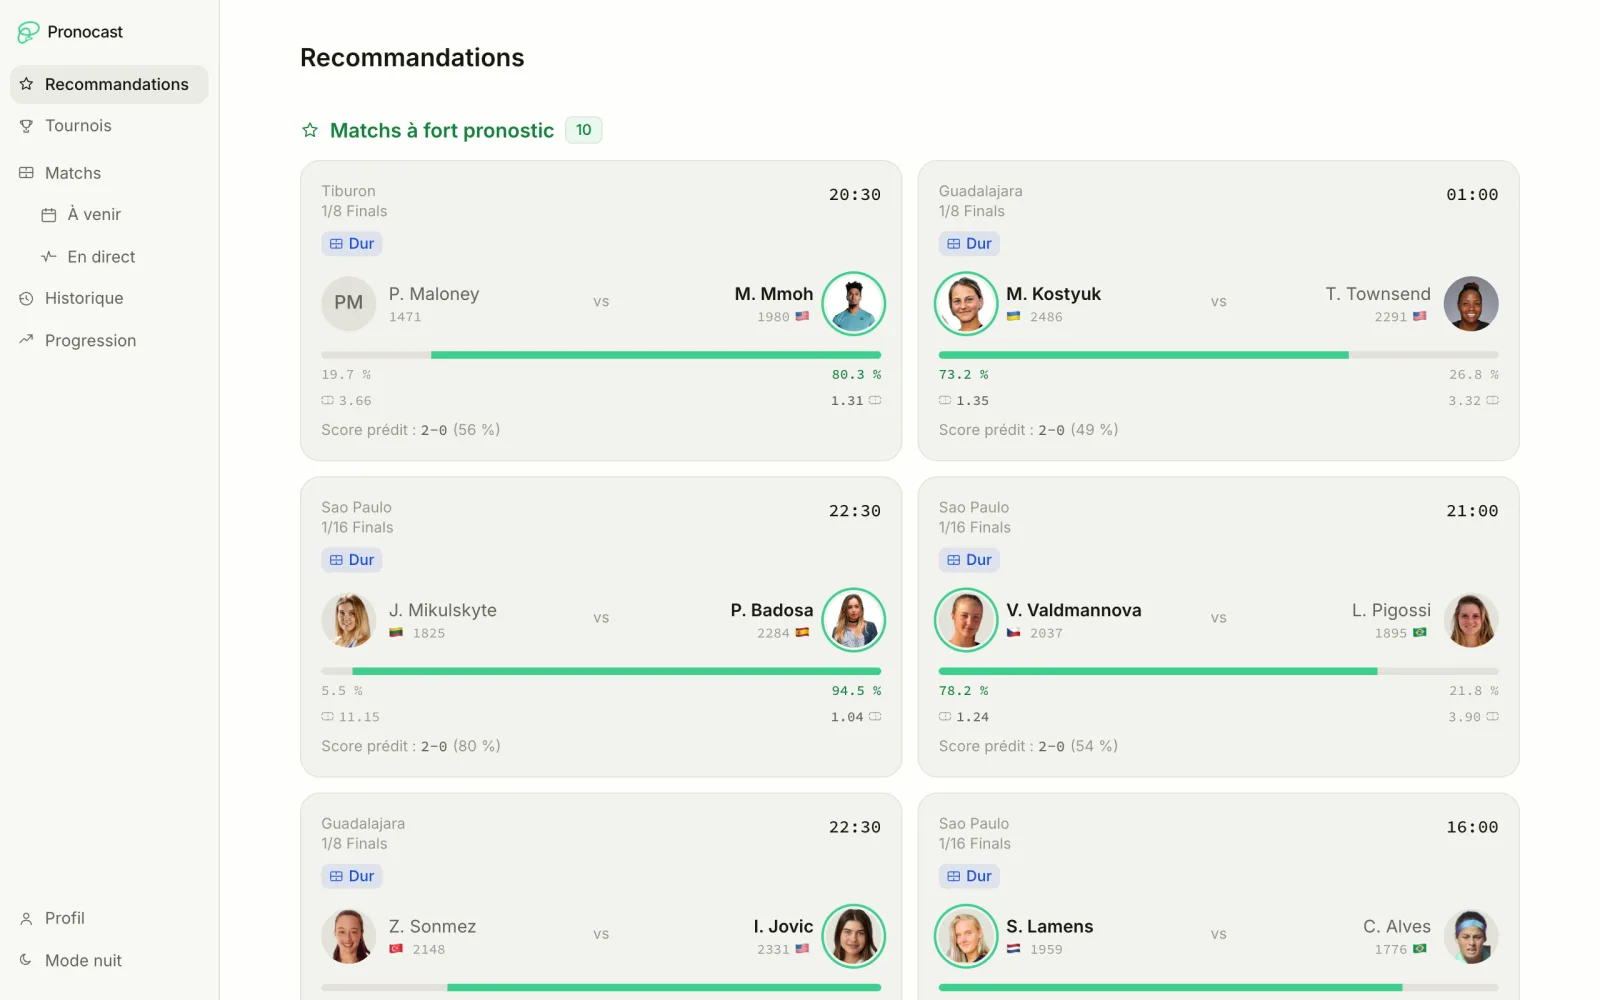
A bookmaker's odds are not just a payout multiplier. They are a probability in disguise, and most people misread them: they see a number like 1.80 and take away only "I get 1.80 times my stake back", without ever converting that number into what it actually says about a player's chances. That conversion is exactly what lets you compare odds to a prediction, spot a gap between the two, and understand why the betting market remains, to this day, a benchmark few models beat for long.
This article explains how to read a price, why the probabilities it implies always add up to more than 100%, how to remove that margin to get a real probability, and how the Pronocast model uses it.
Converting odds into a probability
With decimal odds (the convention used throughout the app), the conversion is direct: implied probability = 1 ÷ odds. Odds of 1.50 imply a 66.7% probability; odds of 3.00 imply 33.3%; odds of 1.10 imply just over 90%. The lower the odds, the more likely the bookmaker — and the market behind it — judges that outcome to be.
A worked example
On a match where the favourite is priced at 1.40 and the underdog at 3.20: 1 ÷ 1.40 = 71.4%, and 1 ÷ 3.20 = 31.3%. Two things stand out. First, the favourite looks clearly more likely, which is consistent. Second, the two percentages add up to 102.7%, not 100%. That is not a rounding error.
The bookmaker's margin, or why it never adds up to 100%
That surplus above 100% is called the margin, or overround. It is the bookmaker's commission, built directly into the odds rather than charged separately: they price both sides of a match slightly below what the true probability would justify, to lock in a profit regardless of the result. In tennis, that margin usually sits between 2% and 6% depending on the bookmaker and how closely watched the match is.
Karl Whelan, an economics professor at University College Dublin, lays out the calculation in a reference write-up on the subject: the margin is found by adding up the implied probabilities of every possible outcome and subtracting 100% from the total (Calculating the Bookmaker's Profit Margin).
Removing the margin: the de-vigged probability
To get a clean probability estimate, that margin needs to be spread across both outcomes rather than left inflating each of them artificially. The simplest method, proportional normalisation, divides each implied probability by the sum of all implied probabilities for the match.
On the example above
71.4% and 31.3% add up to 102.7%. The favourite's de-vigged probability becomes 71.4 ÷ 102.7 ≈ 69.5%, and the underdog's 31.3 ÷ 102.7 ≈ 30.5%. Those two figures add up to exactly 100%: that is the version with statistical meaning, not the raw percentages read straight off the price.
Why the market beats (almost) every model
Odds are not set at random. They start from a bookmaker's own estimate, then move with money placed by tens of thousands of bettors, a small professional minority of whom correct mispriced odds until they stop being profitable to attack. The result aggregates far more information than any single statistical model, however carefully built.
That is exactly what the academic research on the topic measures. Reviewing dozens of tennis prediction models, Sascha Wilkens finds that nearly all of them plateau between 70% and 75% accuracy regardless of how sophisticated the approach is, and that most fail to durably beat the accuracy already embedded in bookmaker odds (Wilkens, "Sports prediction and betting models in the machine learning age: The case of tennis", Journal of Sports Analytics, 2021). It is the same study behind the 70% benchmark cited in Pronocast's methodology.
How Pronocast uses the market price
Rather than ignoring that signal on principle, the model reads it. When odds are available for a match, their de-vigged implied probability (per the method above) is blended with the probability the model computes from Elo, form and head-to-head history. The blend never fully replaces the model: on matches with no odds available (roughly 8% of cases, never in doubles), and across most Challenger tournaments where odds are scarcer, the model stands alone.
When odds do exist, the gap between them and the model's own probability is published on every match page: a wide gap signals a disagreement between model and market, in either direction, rather than being hidden behind a single final number.
Reading the odds on Pronocast
Bookmaker odds are shown on every upcoming prediction that has them, next to the model's own probability. They are visible on the daily predictions page, by tour on the ATP, WTA and Challenger hubs, and on the recommendations page, which ranks matches by expected return rather than confidence alone whenever odds make that calculation possible.
Frequently asked questions
- How do you calculate the implied probability of tennis odds?
- By dividing 1 by the decimal odds. Odds of 1.50 imply a 66.7% probability, odds of 3.00 imply 33.3%. It's a direct conversion that still includes the bookmaker's margin.
- Why do implied probabilities add up to more than 100%?
- Because of the bookmaker's margin (the overround), built into both prices of a match rather than charged separately. In tennis it usually sits between 2% and 6%. It needs to be removed, by normalisation, to get a usable probability.
- Is the betting market more reliable than a tennis prediction model?
- Academic research on the topic finds that most models plateau between 70% and 75% accuracy and fail to durably beat the accuracy already embedded in bookmaker odds, which aggregate information from tens of thousands of bettors.
- How does Pronocast use the market price?
- When odds are available, their de-vigged probability is blended with the model's own. On matches with no odds (roughly 8% of cases) and most Challenger tournaments, the model stands alone; the gap between model and market is published on every match page.
Other articles
- Tennis prediction algorithm: how an AI model actually worksWhat a tennis prediction model really receives, how it learns without cheating with time, and why its accuracy plateaus around the market’s.
- Elo in tennis: understanding the rating that predicts matchesWhy a rating designed for chess predicts a tennis match better than the ATP ranking, and which adjustments it needs to really work.
- How to bet on tennis: bankroll, value betting and riskHow much to stake, what value really means, and why our own model lost 9% betting on its disagreements with the market.
- Clay, hard or grass: what the surface really changes in tennisAcross 36,210 matches, a player’s overall level predicts better than their record on the day’s surface, and grass is where favourites fall most often.
- Head-to-head in tennis: does the H2H really predict the winner?Across 38,123 matches, the head-to-head leader wins less often than the Elo favourite. But a record against the favourite really does count.
- Tennis fatigue and rest: do tired players really lose more?Stringing matches together is barely measurable. Returning after a month without playing is: nearly ten points of win probability less than Elo predicts.
- Indoor tennis: are favourites more reliable under a roof?Indoors, the favourite wins 64.9% of matches, against 65.0% on outdoor hard courts. A good indoor record mostly reflects a good player.